Inventory Valuation & Profitability Report
This page helps you understand stock value, sales revenue, gross profit, losses, dead stock, and the final net result of each product. It is not just a stock report. It is a financial performance report for inventory.
Overview
The report is built to answer practical business questions. It tells you how much inventory was purchased, how much is still sitting in stock, how much has been sold, how much profit has been earned from selling, how much money has been lost because of stock damage or other reasons, and what the final financial outcome is after deducting those losses.
In simple words, this report shows whether your inventory is helping the business, blocking cash, or quietly causing hidden losses.
- Finding products that are profitable.
- Finding products with high losses.
- Finding products with no sales.
- Finding products with high stock value but poor movement.
- Finding dead stock after 30, 60, or 90 days.
- Understanding how stock damage, expiry, lost stock, internal usage, sample usage, and other reasons affect profitability.
- Reviewing the final net outcome of each product after both profit and losses are considered.
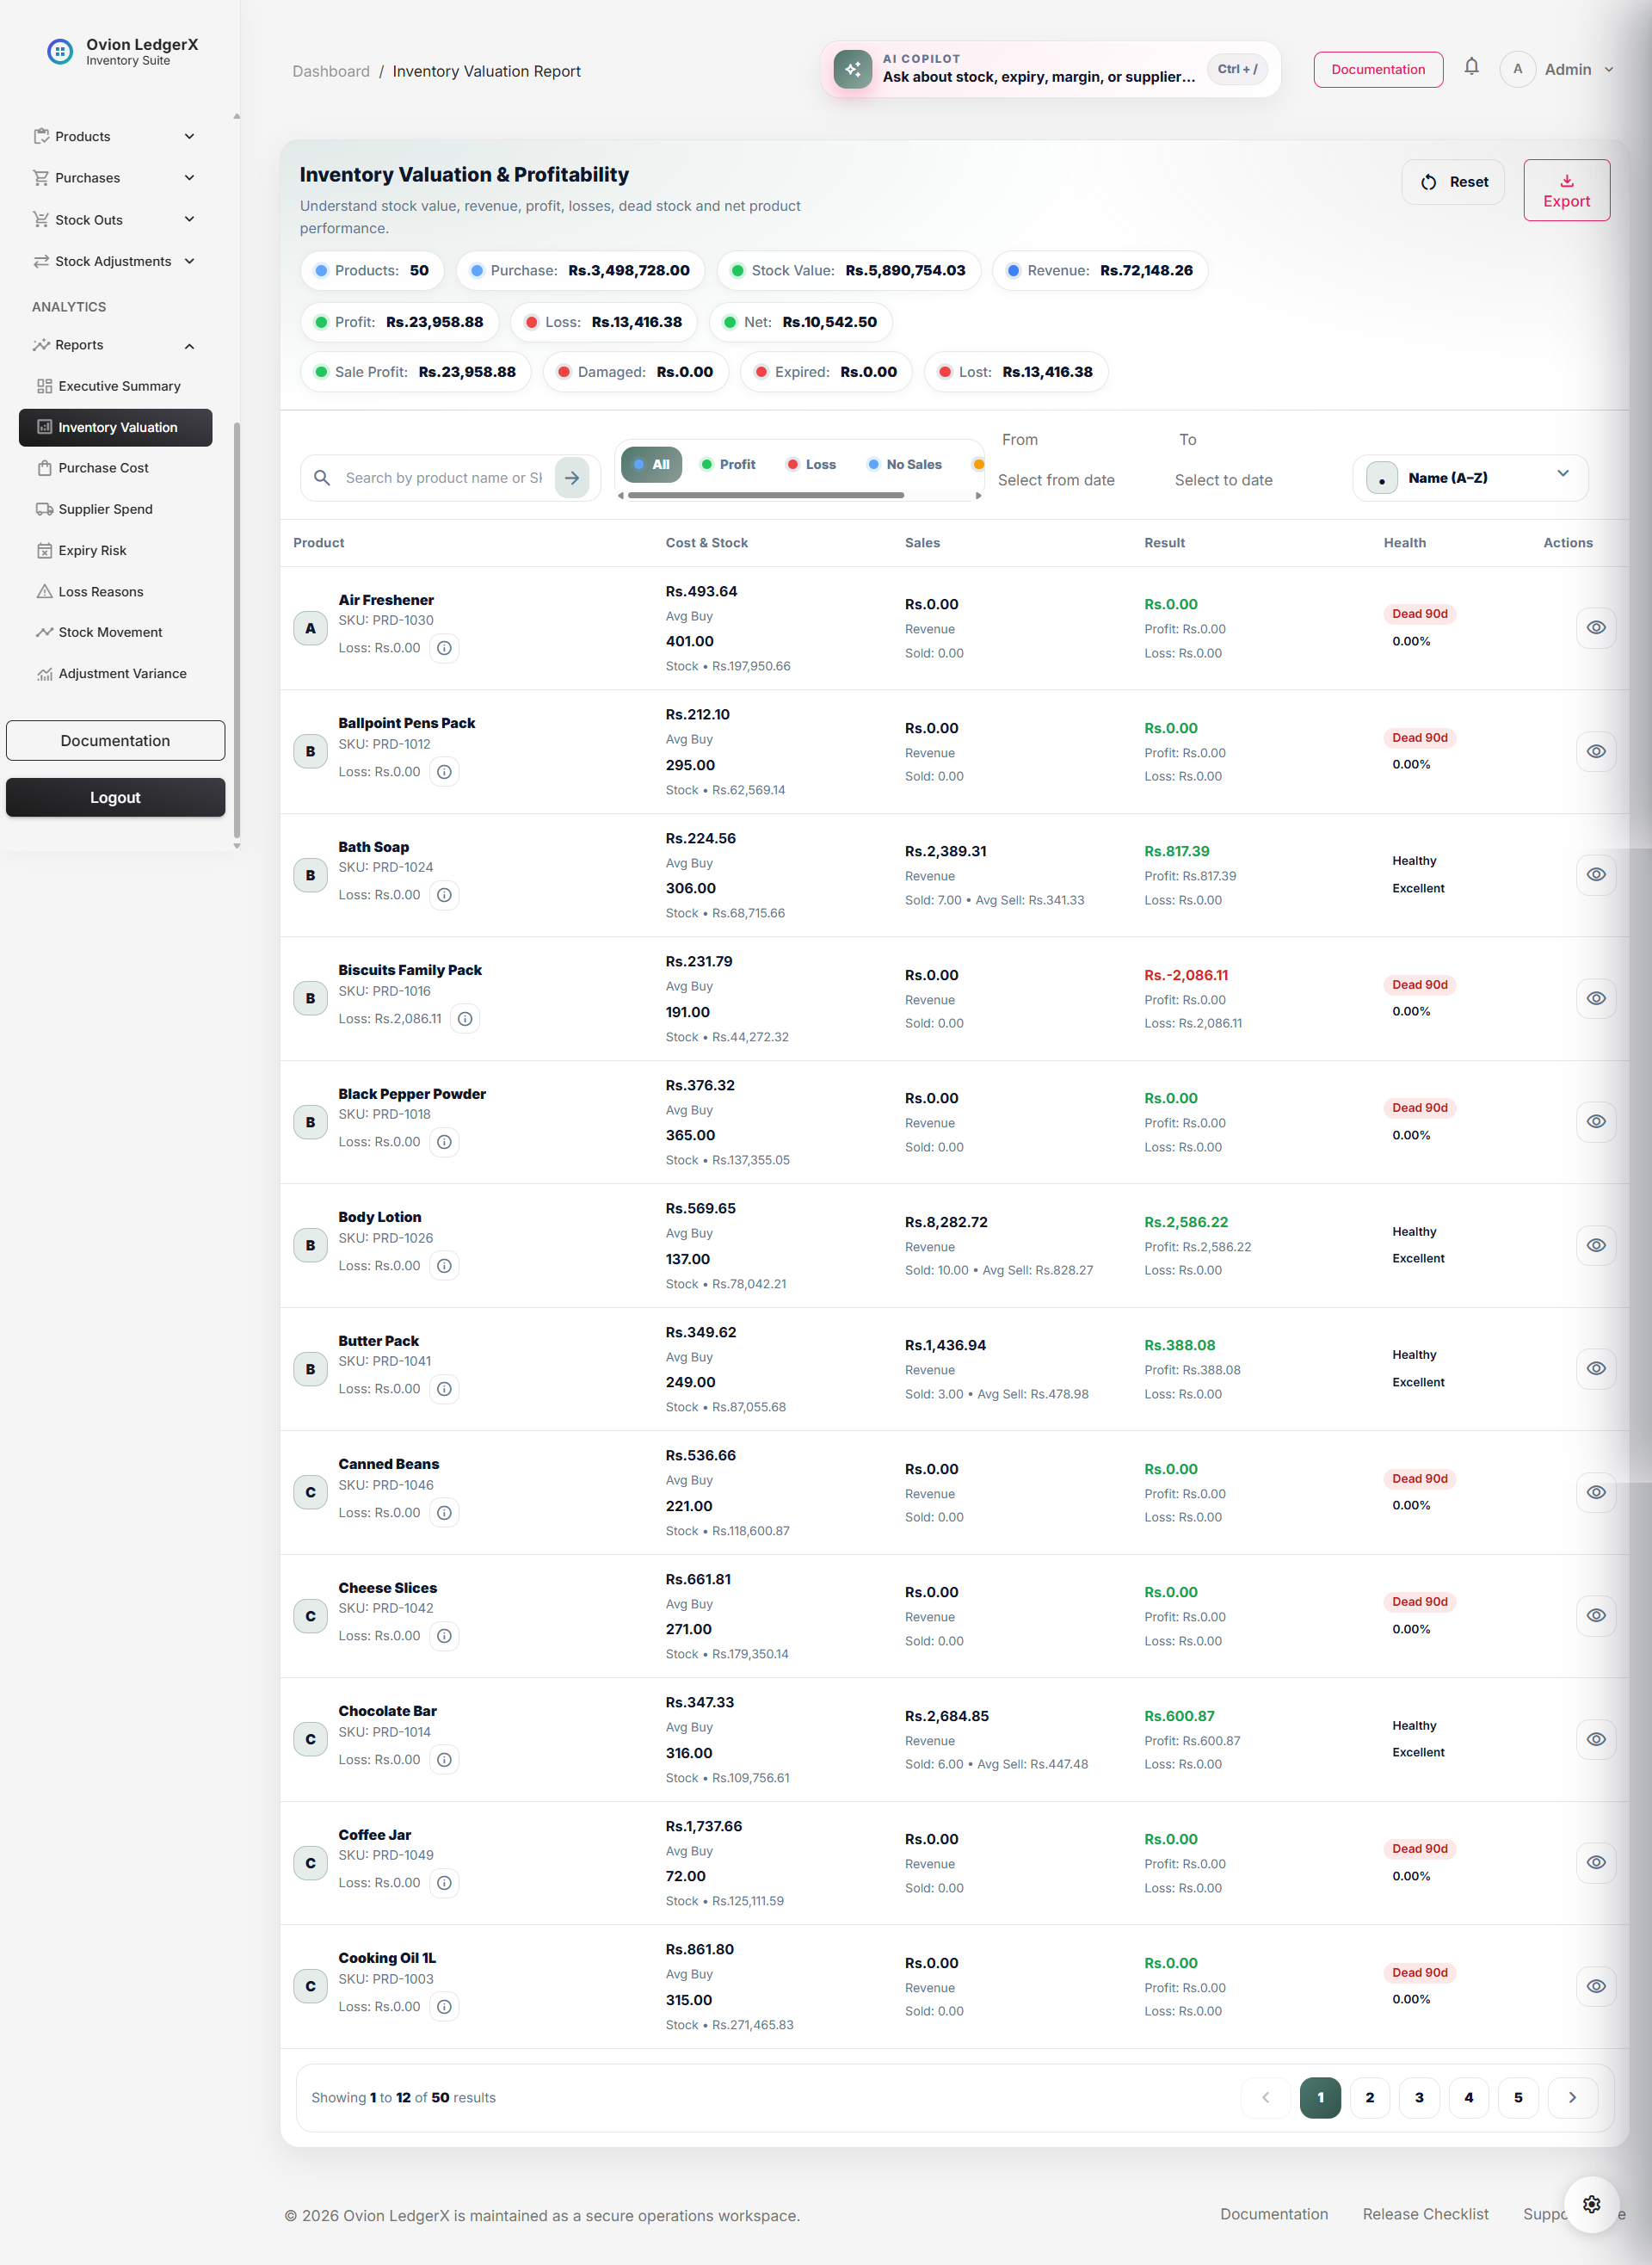
Top Summary Metrics
At the top of the page, summary chips show the overall combined result of all products currently visible under the applied filters. These values help the user understand the report at a glance before studying product-level rows.
- Products: The total number of products currently included in the report after search, date filtering, and view filtering are applied.
- Purchase: The total purchase value of all included products. This shows how much money has been spent on purchasing those products.
- Stock Value: The current monetary value of the stock that is still available. This is based on current stock multiplied by average purchase cost.
- Revenue: The total sales revenue generated from manual sales of the included products.
- Profit: The total gross profit earned from manual sales before deducting additional loss categories.
- Loss: The total value lost through damaged stock, expired stock, lost stock, internal usage, sample usage, other stock-out reasons, and any sales-related loss values.
- Net: The final overall result after subtracting total loss from gross profit. This is the clearest final financial figure on the page.
- Sale Profit: The total gross profit from manual sale transactions only.
- Damaged: Total monetary loss caused by stock marked as damaged.
- Expired: Total monetary loss caused by stock that expired.
- Lost: Total monetary loss caused by lost stock.
Search, Filters, Dates & Sorting
The toolbar above the table helps the user narrow the report to only the products they want to study. These controls are important because valuation reports become much more useful when the user can isolate profitable products, loss-making products, no-sales products, or dead stock.
- Search by product name or SKU: Searches the report using product name or SKU. This is useful when the user wants to locate one specific product quickly.
- All: Shows every product included in the report.
- Profit: Shows only products with a positive net result.
- Loss: Shows only products with a negative net result.
- No Sales: Shows products that still have current stock but have not been sold.
- Dead 90d: Shows products that are considered dead stock at the strongest level shown in the quick filter.
- From: Filters purchase and stock-out summaries from a selected start date onward.
- To: Filters purchase and stock-out summaries up to a selected end date.
- Sort dropdown: Lets the user reorder results by name, stock value, revenue, profit, loss, net value, margin, or dead stock severity.
- Reset: Clears filters and reloads the report in its default state.
Table Structure
The main report table is the heart of this page. It is divided into six columns: Product, Cost & Stock, Sales, Result, Health, and Actions.
- Product
- Cost & Stock
- Sales
- Result
- Health
- Actions
Column 1 - Product
This column identifies the product and gives the user a quick entry point into its valuation record.
- Avatar / initial: A simple visual indicator using the first letter of the product name. It improves recognition, especially in long tables.
- Product name: The main visible product identity. Clicking the product name opens the product drilldown page for deeper analysis.
- SKU: The stock keeping unit used as the unique operational identity of the product.
- Loss: Displays the total combined loss value for that product.
- Info button: Opens the loss breakdown drawer so the user can see exactly which loss reasons contributed to the total loss.
- Product: Means the inventory item being evaluated financially.
- SKU: Means Stock Keeping Unit, a unique business identifier for the item.
- Loss: Means the monetary value that was lost rather than earned.
Column 2 - Cost & Stock
This column explains what the product costs the business and what value is currently locked in the remaining stock.
- Average purchase cost: The average buying cost per unit, calculated from total purchased value divided by total purchased quantity.
- Avg Buy: A label showing that the value above it is the average cost of buying one unit.
- Current stock quantity: The number of units currently available.
- Stock value: The estimated money currently tied up in remaining stock, calculated from current stock multiplied by average purchase cost.
- Cost: Means what the product costs the business, not what it sells for.
- Stock: Means the quantity still physically or system-wise available.
- Avg: Means average.
- Buy: Means the buying price from purchase records.
- Stock Value: Means the current monetary worth of remaining stock at purchase-cost basis.
Column 3 - Sales
This column explains how the product performed on the selling side. It focuses only on sale movement and selling value.
- Sales revenue: The total money received from manual sale transactions for this product.
- Revenue: A label showing that the amount above it is total earned selling value before subtracting costs and losses.
- Sold quantity: The total number of units sold through manual sale transactions.
- Average sell price: The average price at which each sold unit was sold, calculated from sales revenue divided by sold quantity.
- Sales: Means sale activity related to this product.
- Revenue: Means incoming money from sales, before deducting expenses or losses.
- Sold: Means the quantity that left inventory through manual sales.
- Avg Sell: Means average selling price per sold unit.
Column 4 - Result
This is one of the most important columns on the page because it gives the final financial picture of the product.
- Net result: The final financial outcome after total loss is subtracted from gross profit.
- Profit: Shows the gross profit value earned from sales before non-sale losses are deducted.
- Loss: Shows the total combined loss value for the product.
- Result: Means the final outcome of product performance.
- Net: Means the final amount after all deductions and offsets.
- Profit: Means earnings after sales cost is deducted from sales revenue.
- Loss: Means monetary reduction caused by non-profitable stock-out reasons or sale loss.
Column 5 - Health
The Health column converts raw numbers into easier business labels. This makes the page more readable for non-technical users.
- Healthy: The product has gross profit and no meaningful additional loss dragging it down.
- Loss Risk: The product is financially risky because its net result has dropped below zero.
- Inactive: The product has no stock and no sales movement.
- Dead 30d: The product still has stock but has had no sale movement for at least 30 days.
- Dead 60d: The product still has stock but has had no sale movement for at least 60 days.
- Dead 90d: The product still has stock but has had no sale movement for at least 90 days, or it has stock but never sold at all.
- Mixed: The product does not strongly fit the most positive or most negative categories.
- Excellent: Margin is 25% or higher.
- Good: Margin is from 10% up to but below 25%.
- Low Margin: Margin is from 0% up to but below 10%.
- Loss Making: Margin is below 0%.
- Health: Means the business condition of the product when profitability, stock movement, and dead stock risk are considered together.
- Margin: Means the percentage of gross profit compared against sales cost.
- Dead Stock: Means stock that still exists but is not moving through sales.
Column 6 - Actions
This column gives the user a quick way to move from summary view into detailed product drilldown.
- View icon: Opens the drilldown page for that product so the user can inspect deeper financial and stock details.
Loss Breakdown Drawer
The small information button inside the Product column opens a side drawer. This drawer is extremely important because it explains where the total loss came from. Instead of showing only one total number, it breaks that number into reasons.
- SKU: Shows the product SKU for identity confirmation.
- Total Loss: The complete sum of all loss-related values for that product.
- Damaged: Loss from stock marked as damaged.
- Expired: Loss from stock marked as expired.
- Lost: Loss from stock marked as lost.
- Internal: Cost consumed through internal usage.
- Sample: Cost consumed through sample distribution.
- Other: Cost recorded under other stock-out reasons.
- Sales Loss: Any loss amount attached to manual sale records.
- Summary total: Repeats the grand total loss to make the drawer easier to read at the end.
Calculation Logic
This report does not simply read values already saved as final totals. It calculates many important figures from purchase summaries and stock-out summaries.
- Average Purchase Cost = total purchased value ÷ total purchased quantity
- Average Sell Price = total sales revenue ÷ total sold quantity
- Stock Value = current stock × average purchase cost
- Total Loss = damaged loss + expired loss + lost loss + internal cost + sample cost + other cost + sales loss
- Net Result = gross profit - total loss
- Margin Percent = (gross profit ÷ sales cost) × 100
- If current stock is greater than zero and sold quantity is zero, the product is treated as dead stock at the strongest level.
- If there is stock and the last sale date exists, the product is assigned a dead stock band depending on how many days have passed since the last sale.
- 30 or more days without sale movement leads to Dead 30d.
- 60 or more days without sale movement leads to Dead 60d.
- 90 or more days without sale movement leads to Dead 90d.
- Inactive: no stock and no sales.
- Dead: dead stock band exists.
- Loss: net result is below zero.
- Healthy: gross profit exists and total loss is zero or not materially present.
- Mixed: none of the stronger states above fully apply.
Important Business Concepts Used on This Page
- Purchase Value: The amount spent on acquiring stock.
- Stock Value: The current money tied up in remaining stock.
- Revenue: The money earned from sales before subtracting costs.
- Sales Cost: The purchase-cost basis of the units that were sold.
- Gross Profit: Sales revenue minus sales cost.
- Loss Value: Money lost through non-profitable stock-out reasons or losses attached to sale records.
- Net Result: What truly remains after all loss values are subtracted from gross profit.
- Dead Stock: Stock that exists but is not moving through sales for a long period.
- Margin: The profit ratio relative to the cost of sold goods.
Empty State
If no matching records are found, the report shows an empty state message. This usually means the applied search term, view filter, or date range does not match any product data currently available in the report.
- No valuation records found: No products matched the current report filters.
- Try changing filters or seed more data: A practical suggestion to either broaden the filter conditions or add more sample/business data.
Pagination
The report uses pagination so large product datasets stay manageable. This means only a fixed number of rows are shown on one page, and the user can move to the next page to continue reviewing records.
Important Notes
- The report is based on completed purchase records and completed stock-out records.
- Search works on product name and SKU.
- Date filters affect both purchase and stock-out summaries.
- Gross profit and net result are not the same thing.
- A product may sell well but still become net negative if loss categories are high.
- Dead stock is based on stock still existing with missing or old sale movement.
- The loss drawer should be checked whenever the total loss value looks unusually high.